


Click here to subscribe FREE to Ray Hanania's Columns
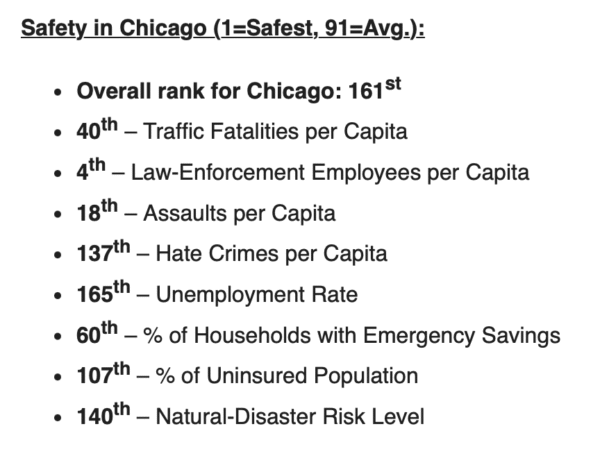
Chicago ranks as 161st worst city for crime in new national survey
Threats to safety in the U.S. come in many forms, from public health crises and natural disasters to mass shootings and traffic accidents. People can feel unsafe in other ways, too.
Aside from the types of hazards that can cause bodily injury or other physical harm, taking out an unaffordable second mortgage, forgoing health insurance or even visiting unsecured websites are also ways people run into danger.
One big worry for many people right now is the cost of inflation, which threatens Americans’ financial safety.
No one can avoid all danger, however, and we take on a certain level of risk based on where we choose to live. Some cities are simply better at protecting their residents from harm.
To determine where Americans can feel most secure — in more than one sense — WalletHub compared more than 180 cities across 41 key indicators of safety. Our data set ranges from traffic fatalities per capita and assaults per capita to the unemployment rate and the percentage of the population that is uninsured.
Top 5 Safest Cities in the U.S.
- Warwick, RI
- Overland Park, KS
- Burlington, VT
- Juneau, AK
- Yonkers, NY

Chip Lupo, WalletHub Analyst
Safest Cities in the U.S.
| Overall Rank* | City | Total Score | Home & Community Safety Rank | Natural-Disaster Risk Rank | Financial Safety Rank |
|---|---|---|---|---|---|
| 1 | Warwick, RI | 71.21 | 8 | 9 | 44 |
| 2 | Overland Park, KS | 70.04 | 4 | 118 | 16 |
| 3 | Burlington, VT | 68.79 | 33 | 6 | 9 |
| 4 | Juneau, AK | 68.74 | 86 | 1 | 57 |
| 5 | Yonkers, NY | 68.65 | 3 | 29 | 118 |
| 6 | Casper, WY | 68.42 | 51 | 5 | 7 |
| 7 | South Burlington, VT | 68.35 | 46 | 6 | 3 |
| 8 | Columbia, MD | 68.02 | 2 | 11 | 51 |
| 9 | Lewiston, ME | 67.77 | 63 | 4 | 2 |
| 10 | Salem, OR | 66.93 | 52 | 13 | 31 |
| 11 | Nashua, NH | 66.72 | 13 | 111 | 8 |
| 12 | Boise, ID | 66.65 | 41 | 46 | 6 |
| 13 | Laredo, TX | 66.43 | 26 | 25 | 81 |
| 14 | Santa Rosa, CA | 66.43 | 32 | 20 | 93 |
| 15 | Virginia Beach, VA | 66.37 | 27 | 53 | 43 |
| 16 | Nampa, ID | 66.35 | 43 | 16 | 46 |
| 17 | Irvine, CA | 66.05 | 6 | 127 | 116 |
| 18 | Chesapeake, VA | 66.03 | 24 | 42 | 61 |
| 19 | Cedar Rapids, IA | 66.00 | 23 | 43 | 74 |
| 20 | Bismarck, ND | 65.95 | 42 | 65 | 4 |
| 21 | Honolulu, HI | 65.82 | 31 | 57 | 27 |
| 22 | Portland, ME | 65.75 | 58 | 23 | 1 |
| 23 | Chula Vista, CA | 65.52 | 21 | 39 | 113 |
| 24 | Vancouver, WA | 65.45 | 80 | 2 | 70 |
| 25 | Madison, WI | 65.25 | 30 | 88 | 21 |
| 26 | Lincoln, NE | 65.23 | 35 | 115 | 14 |
| 27 | Fremont, CA | 64.98 | 20 | 137 | 65 |
| 28 | Pearl City, HI | 64.91 | 1 | 57 | 13 |
| 29 | Gilbert, AZ | 64.83 | 9 | 155 | 36 |
| 30 | Port St. Lucie, FL | 64.78 | 10 | 56 | 167 |
| 31 | Boston, MA | 64.59 | 50 | 31 | 26 |
| 32 | Omaha, NE | 64.52 | 40 | 96 | 35 |
| 33 | Aurora, IL | 64.50 | 17 | 62 | 126 |
| 34 | Missoula, MT | 64.30 | 88 | 8 | 19 |
| 35 | Fargo, ND | 64.10 | 54 | 74 | 20 |
| 36 | Glendale, CA | 64.02 | 7 | 150 | 146 |
| 37 | West Valley City, UT | 63.76 | 45 | 82 | 37 |
| 38 | Sioux Falls, SD | 63.75 | 57 | 86 | 12 |
| 39 | San Diego, CA | 63.68 | 38 | 39 | 90 |
| 40 | Chandler, AZ | 63.49 | 19 | 155 | 30 |
| 41 | Scottsdale, AZ | 63.49 | 22 | 155 | 24 |
| 42 | Huntington Beach, CA | 63.44 | 25 | 127 | 106 |
| 43 | Worcester, MA | 63.37 | 37 | 80 | 40 |
| 44 | Santa Clarita, CA | 63.30 | 5 | 150 | 175 |
| 45 | Huntsville, AL | 63.28 | 44 | 63 | 42 |
| 46 | Rancho Cucamonga, CA | 63.21 | 18 | 166 | 97 |
| 47 | St. Paul, MN | 63.16 | 74 | 44 | 23 |
| 48 | Moreno Valley, CA | 63.12 | 16 | 68 | 153 |
| 49 | Oceanside, CA | 63.00 | 36 | 39 | 103 |
| 50 | Garden Grove, CA | 62.72 | 29 | 127 | 120 |
| 51 | Oxnard, CA | 62.58 | 49 | 59 | 111 |
| 52 | Bridgeport, CT | 62.31 | 56 | 28 | 91 |
| 53 | Rapid City, SD | 62.02 | 69 | 98 | 5 |
| 54 | Manchester, NH | 61.76 | 55 | 111 | 17 |
| 55 | Cape Coral, FL | 61.52 | 14 | 132 | 168 |
| 56 | Fontana, CA | 61.47 | 28 | 166 | 135 |
| 57 | Hialeah, FL | 61.32 | 12 | 116 | 174 |
| 58 | Providence, RI | 61.23 | 61 | 47 | 96 |
| 59 | Seattle, WA | 61.22 | 109 | 22 | 15 |
| 60 | Fort Wayne, IN | 61.22 | 65 | 32 | 102 |
| 61 | Brownsville, TX | 61.13 | 48 | 95 | 68 |
| 62 | Newport News, VA | 60.66 | 76 | 30 | 85 |
| 63 | Wichita, KS | 60.60 | 73 | 91 | 22 |
| 64 | Des Moines, IA | 60.46 | 71 | 50 | 75 |
| 65 | Grand Prairie, TX | 60.39 | 11 | 179 | 125 |
| 66 | Peoria, AZ | 60.34 | 39 | 143 | 53 |
| 67 | Cheyenne, WY | 59.86 | 79 | 114 | 29 |
| 68 | Billings, MT | 59.86 | 113 | 37 | 10 |
| 69 | Reno, NV | 59.73 | 110 | 26 | 52 |
| 70 | Modesto, CA | 59.71 | 104 | 21 | 87 |
| 71 | Mesa, AZ | 59.68 | 53 | 155 | 49 |
| 72 | Anchorage, AK | 59.33 | 135 | 3 | 18 |
| 73 | Raleigh, NC | 59.32 | 60 | 165 | 32 |
| 74 | Austin, TX | 59.23 | 64 | 142 | 45 |
| 75 | Jersey City, NJ | 58.94 | 93 | 17 | 137 |
| 76 | Lubbock, TX | 58.88 | 62 | 120 | 95 |
| 77 | Ontario, CA | 58.71 | 47 | 166 | 139 |
| 78 | Winston-Salem, NC | 58.61 | 78 | 97 | 69 |
| 79 | Irving, TX | 58.49 | 34 | 178 | 112 |
| 80 | Amarillo, TX | 58.46 | 82 | 154 | 38 |
| 81 | Charlotte, NC | 58.45 | 66 | 135 | 82 |
| 82 | Grand Rapids, MI | 58.44 | 98 | 64 | 48 |
| 83 | New Haven, CT | 58.41 | 102 | 36 | 73 |
| 84 | San Jose, CA | 58.39 | 100 | 99 | 39 |
| 85 | Pembroke Pines, FL | 58.36 | 15 | 174 | 171 |
| 86 | Montgomery, AL | 58.31 | 84 | 34 | 141 |
| 87 | Columbus, GA | 58.16 | 70 | 48 | 172 |
| 88 | Anaheim, CA | 58.12 | 72 | 127 | 127 |
| 89 | North Las Vegas, NV | 57.99 | 59 | 103 | 173 |
| 90 | Lexington-Fayette, KY | 57.97 | 91 | 73 | 80 |
| 91 | Rochester, NY | 57.85 | 95 | 67 | 83 |
| 92 | Norfolk, VA | 57.55 | 92 | 79 | 84 |
| 93 | Spokane, WA | 57.54 | 115 | 24 | 79 |
| 94 | Riverside, CA | 57.52 | 85 | 68 | 131 |
| 95 | Sacramento, CA | 56.82 | 114 | 54 | 99 |
| 96 | Santa Ana, CA | 56.81 | 81 | 127 | 133 |
| 97 | Durham, NC | 56.72 | 89 | 148 | 33 |
| 98 | El Paso, TX | 56.69 | 99 | 78 | 101 |
| 99 | St. Petersburg, FL | 56.60 | 101 | 45 | 136 |
| 100 | Salt Lake City, UT | 56.58 | 122 | 82 | 28 |
| 101 | Fort Smith, AR | 56.31 | 107 | 106 | 41 |
| 102 | Tampa, FL | 56.30 | 77 | 147 | 115 |
| 103 | Charleston, WV | 56.24 | 126 | 55 | 11 |
| 104 | Tempe, AZ | 56.21 | 83 | 155 | 47 |
| 105 | Fresno, CA | 55.94 | 87 | 176 | 117 |
| 106 | Henderson, NV | 55.73 | 96 | 103 | 151 |
| 107 | Oklahoma City, OK | 55.61 | 105 | 141 | 58 |
| 108 | Huntington, WV | 55.51 | 137 | 14 | 55 |
| 109 | Plano, TX | 55.51 | 75 | 171 | 88 |
| 110 | Newark, NJ | 55.42 | 94 | 35 | 179 |
| 111 | Las Cruces, NM | 55.34 | 116 | 60 | 89 |
| 112 | Tucson, AZ | 55.19 | 127 | 27 | 98 |
| 113 | Miami, FL | 55.16 | 68 | 116 | 180 |
| 114 | Greensboro, NC | 54.96 | 108 | 123 | 104 |
| 115 | Arlington, TX | 54.94 | 67 | 181 | 130 |
| 116 | Minneapolis, MN | 54.56 | 129 | 133 | 25 |
| 117 | New York, NY | 54.34 | 123 | 66 | 100 |
| 118 | Springfield, MO | 54.29 | 133 | 51 | 63 |
| 119 | Gulfport, MS | 54.18 | 97 | 144 | 107 |
| 120 | Tallahassee, FL | 54.00 | 106 | 139 | 123 |
| 121 | San Francisco, CA | 53.96 | 149 | 10 | 86 |
| 122 | Stockton, CA | 53.67 | 131 | 52 | 138 |
| 123 | Long Beach, CA | 53.58 | 112 | 150 | 148 |
| 124 | San Antonio, TX | 53.55 | 111 | 162 | 108 |
| 125 | Fort Worth, TX | 53.42 | 90 | 177 | 143 |
| 126 | Knoxville, TN | 53.36 | 132 | 90 | 62 |
| 127 | Aurora, CO | 53.35 | 125 | 93 | 132 |
| 128 | Tulsa, OK | 53.18 | 120 | 119 | 92 |
| 129 | Bakersfield, CA | 52.85 | 124 | 109 | 134 |
| 130 | Corpus Christi, TX | 52.48 | 147 | 18 | 56 |
| 131 | Glendale, AZ | 52.46 | 118 | 155 | 72 |
| 132 | Columbia, SC | 52.14 | 119 | 126 | 129 |
| 133 | Garland, TX | 52.07 | 103 | 173 | 145 |
| 134 | Indianapolis, IN | 51.94 | 138 | 33 | 128 |
| 135 | Cincinnati, OH | 51.36 | 134 | 102 | 121 |
| 136 | Phoenix, AZ | 51.28 | 130 | 155 | 71 |
| 137 | Charleston, SC | 50.98 | 128 | 145 | 78 |
| 138 | Pittsburgh, PA | 50.97 | 143 | 84 | 50 |
| 139 | Portland, OR | 50.96 | 157 | 19 | 34 |
| 140 | Buffalo, NY | 50.36 | 141 | 108 | 59 |
| 141 | Tacoma, WA | 50.22 | 161 | 12 | 60 |
| 142 | Mobile, AL | 50.20 | 117 | 170 | 155 |
| 143 | Fayetteville, NC | 49.62 | 121 | 164 | 160 |
| 144 | Toledo, OH | 49.58 | 136 | 72 | 170 |
| 145 | Kansas City, MO | 49.08 | 153 | 38 | 66 |
| 146 | Dover, DE | 49.00 | 142 | 76 | 144 |
| 147 | Milwaukee, WI | 48.49 | 151 | 49 | 109 |
| 148 | Akron, OH | 47.94 | 140 | 113 | 154 |
| 149 | Louisville, KY | 47.84 | 144 | 134 | 110 |
| 150 | Las Vegas, NV | 47.56 | 145 | 103 | 169 |
| 151 | Augusta, GA | 47.07 | 139 | 89 | 152 |
| 152 | Shreveport, LA | 46.86 | 146 | 75 | 176 |
| 153 | Wilmington, DE | 46.06 | 148 | 121 | 157 |
| 154 | Albuquerque, NM | 45.78 | 162 | 110 | 67 |
| 155 | Colorado Springs, CO | 45.34 | 152 | 180 | 76 |
| 156 | Los Angeles, CA | 44.69 | 150 | 150 | 163 |
| 157 | St. Louis, MO | 44.59 | 170 | 15 | 140 |
| 158 | Birmingham, AL | 44.01 | 156 | 94 | 165 |
| 159 | Columbus, OH | 43.83 | 164 | 85 | 122 |
| 160 | Orlando, FL | 43.45 | 160 | 122 | 119 |
| 161 | Chicago, IL | 43.16 | 154 | 140 | 159 |
| 162 | Denver, CO | 42.86 | 172 | 81 | 105 |
| 163 | Dallas, TX | 42.77 | 155 | 172 | 142 |
| 164 | Little Rock, AR | 42.75 | 159 | 146 | 114 |
| 165 | Jacksonville, FL | 42.28 | 158 | 124 | 158 |
| 166 | Nashville, TN | 41.98 | 168 | 149 | 54 |
| 167 | Chattanooga, TN | 41.80 | 174 | 77 | 64 |
| 168 | Richmond, VA | 41.39 | 175 | 70 | 94 |
| 169 | Oakland, CA | 41.28 | 169 | 137 | 124 |
| 170 | Jackson, MS | 40.43 | 167 | 125 | 149 |
| 171 | Atlanta, GA | 40.26 | 163 | 163 | 164 |
| 172 | Washington, DC | 39.81 | 178 | 92 | 77 |
| 173 | Cleveland, OH | 39.74 | 171 | 107 | 162 |
| 174 | Philadelphia, PA | 39.39 | 176 | 87 | 150 |
| 175 | San Bernardino, CA | 38.57 | 173 | 166 | 156 |
| 176 | Houston, TX | 38.10 | 165 | 182 | 161 |
| 177 | Fort Lauderdale, FL | 37.28 | 166 | 174 | 178 |
| 178 | Baltimore, MD | 36.69 | 180 | 61 | 166 |
| 179 | Detroit, MI | 36.38 | 177 | 100 | 181 |
| 180 | Baton Rouge, LA | 33.74 | 181 | 136 | 147 |
| 181 | Memphis, TN | 33.71 | 179 | 101 | 182 |
| 182 | New Orleans, LA | 31.57 | 182 | 71 | 177 |
Note: *No. 1 = Safest
With the exception of “Total Score,” all of the columns in the table above depict the relative rank of that city, where a rank of 1 represents the best conditions for that metric category.
Click here to subscribe FREE to Ray Hanania's Columns


His award winning columns can be found at www.HANANIA.COM Subscribe FREE today
Hanania also writes about Middle East issues for the Arab News, and The Arab Daily News criticizing government policies in the Israeli-Palestinian conflict.
Hanania was named "Best Ethnic American Columnist" by the New America Media in November 2007, and is the 2009 recipient of the SPJ National Sigma Delta Chi Award for column writing.
Email Ray Hanania at [email protected].
Follow RayHanania at Twitter