Chicago home values rank among lowest in nation
Chicago ranks among the worst in terms of owning a home among 300 cities across the country, and among the worst in the top 64 largest cities in the country. A new study by WalletHub compares the health of the real estate market in 300 cities and 64 of the countries top. Chicago ranks slightly higher in terms of affordability but still among the 20 percent of the worst cities.
With home values up 5.2% from last year but affordability dropping as mortgage rates get higher, the personal-finance website WalletHub today released its report on 2019’s Best Real-Estate Markets as well as accompanying videos.
To determine the most attractive real-estate markets in the U.S., WalletHub compared 300 cities across 23 key metrics. The data set ranges from median home-price appreciation to home sales turnover rate to job growth.
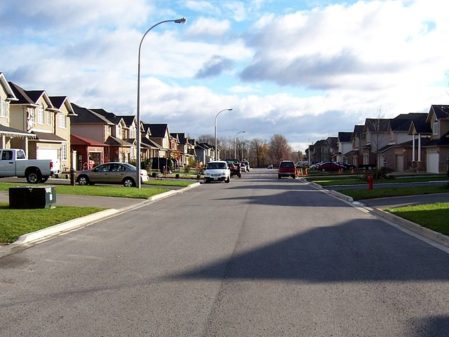
Health of Chicago’s Real-Estate Market (1=Best; 150=Avg.):
- 251st – % of Homes with Negative Equity
- 200th – Avg. Days Until Sale
- 172nd – Median Home-Price Appreciation
- 257th – Job Growth Rate
- 245th – Foreclosure Rate
- 214th – % of Delinquent Mortgage Holders
- 252nd – Number of Unsold Homes Owned by Banks (REOs)
- 136th – Home Price as % of Income
- 256th – Population Growth Rate
Chicago ranks 284th overall (out of 300 cities) and 61st among 64 of the largest cities.
Whether you’re joining the real-estate business or just looking for a place to call home, it’s important to get a handle on the housing markets you’re considering before investing in a property. With unemployment falling and house prices rising, the market as a whole has been in a boom, despite the fact that the new tax code has drastically reduced mortgage interest deductions. But while home values are rising, up 5.2% from last year, fewer homes are affordable because mortgage rates are rising. However, home prices and rental rates vary widely across the U.S. based on supply and demand.
If you aim for long-term growth, equity and profit, you’ll need to look beyond tangible factors like square footage and style. Those factors certainly drive up property values. From an investor’s standpoint, though, they hold less significance than historical market trends and the economic health of residents.
To determine the best local real-estate markets in the U.S., WalletHub compared 300 cities of varying sizes across 23 key indicators of housing-market attractiveness and economic strength. Our data set ranges from median home-price appreciation to home sales turnover rate to job growth. Read on for our findings, expert insight from a panel of researchers and a full description of our methodology.
This chart shows the top 30 Best cities to own a home
| Overall Rank (1=Best) | City | Total Score | ‘Real-Estate Market’ Rank | ‘Affordability & Economic Environment’ Rank |
|---|---|---|---|---|
| 1 | Boise, ID | 73.68 | 1 | 38 |
| 2 | Frisco, TX | 72.44 | 9 | 1 |
| 3 | Overland Park, KS | 71.69 | 2 | 57 |
| 4 | Cary, NC | 71.07 | 7 | 3 |
| 5 | Denton, TX | 70.51 | 3 | 41 |
| 6 | McKinney, TX | 70.23 | 26 | 2 |
| 7 | Carrollton, TX | 70.02 | 6 | 21 |
| 8 | Durham, NC | 69.67 | 4 | 37 |
| 9 | Allen, TX | 69.52 | 13 | 6 |
| 10 | Fort Wayne, IN | 69.51 | 5 | 51 |
| 11 | Murfreesboro, TN | 69.19 | 18 | 4 |
| 12 | Austin, TX | 68.47 | 12 | 28 |
| 13 | Fort Worth, TX | 68.23 | 16 | 27 |
| 14 | Gilbert, AZ | 67.99 | 25 | 8 |
| 15 | Grand Rapids, MI | 67.88 | 8 | 103 |
| 16 | Thornton, CO | 67.58 | 19 | 43 |
| 17 | Spokane Valley, WA | 67.12 | 17 | 83 |
| 18 | Aurora, CO | 67.11 | 11 | 121 |
| 19 | Wilmington, NC | 66.83 | 10 | 156 |
| 20 | Greeley, CO | 66.8 | 20 | 84 |
| 21 | Denver, CO | 66.8 | 14 | 131 |
| 22 | Charlotte, NC | 66.6 | 29 | 22 |
| 23 | Nashville, TN | 66.45 | 24 | 70 |
| 24 | Hillsboro, OR | 66.42 | 35 | 16 |
| 25 | Richardson, TX | 66.32 | 34 | 17 |
| 26 | Lexington, KY | 66.31 | 22 | 86 |
| 27 | Colorado Springs, CO | 66.28 | 28 | 64 |
| 28 | Chico, CA | 66.2 | 23 | 82 |
| 29 | Seattle, WA | 65.84 | 15 | 179 |
| 30 | Bellevue, WA | 65.69 | 21 | 140 |
This Chart shows the 20 worst cities
| 280 | Mobile, AL | 46.08 | 268 | 263 |
| 281 | Albany, NY | 46.02 | 286 | 202 |
| 282 | Fort Lauderdale, FL | 45.99 | 288 | 169 |
| 283 | Waterbury, CT | 45.85 | 278 | 233 |
| 284 | Chicago, IL | 45.58 | 283 | 227 |
| 285 | Rockford, IL | 45.18 | 292 | 167 |
| 286 | Fall River, MA | 45.11 | 279 | 262 |
| 287 | Bridgeport, CT | 44.8 | 285 | 254 |
| 288 | Hartford, CT | 44.63 | 263 | 297 |
| 289 | Cleveland, OH | 44.12 | 289 | 248 |
| 290 | Flint, MI | 43.25 | 276 | 298 |
| 291 | Paterson, NJ | 43.24 | 284 | 290 |
| 292 | Birmingham, AL | 42.83 | 291 | 275 |
| 293 | Baltimore, MD | 42.24 | 295 | 215 |
| 294 | Peoria, IL | 41.89 | 296 | 183 |
| 295 | Jackson, MS | 40.88 | 293 | 287 |
| 296 | Elizabeth, NJ | 40.18 | 294 | 285 |
| 297 | Miami Beach, FL | 39.46 | 298 | 191 |
| 298 | Dayton, OH | 38.76 | 297 | 264 |
| 299 | Detroit, MI | 33.81 | 299 | 300 |
| 300 | Newark, NJ | 33.31 | 300 | 299 |
The study shows that in Illinois, Rockford ranks 5th as having the lowest home price as a percent of income, and ranks 284 out of 300 for having the most unsold homes that are owned by the bank.

