


Click here to subscribe FREE to Ray Hanania's Columns
Wallet Hub releases list of safest largest cities in America
Illinois cities and suburbs barely make this year’s list, but among the safest are Aurora at 13 and Chicago at 133. The Wallet Hub study compares the largest cities in each state based on a range of criteria including number of law enforcement, assaults, hate crimes, unemployment and traffic fatalities
Wallet Hub, the financial services firm which analyzes data across America, released its list of the safest largest cities in America based on a wide range of criteria. Aurora makes the list ranking at 13 while Chicago ranks at the bottom at 133. Many smaller and mid sized cities and communities are not included.
With fears of falling victim to cybercrime, identity theft and home burglaries topping the list of crime worries among Americans, according to the most recent Gallup polls, the personal-finance website WalletHub today released its report on 2018’s Safest Cities in America as well as accompanying videos.
To determine where Americans can feel most protected against life’s hazards, including nonphysical forms of danger, WalletHub compared more than 180 U.S. cities across 39 key metrics. The data set ranges from assaults per capita to unemployment rate to road quality.
Safety in Chicago (1=Safest, 91=Avg.):
- 21st – Traffic Fatalities per Capita
- 1st – Law-Enforcement Employees per Capita
- 141st – Assaults per Capita
- 78th – Hate Crimes per Capita
- 148th – Unemployment Rate
- 52nd – % of Households with Emergency Savings
- 123rd – % of Uninsured Population
- 79th – Natural-Disaster Risk Level
For the full report, please click here.
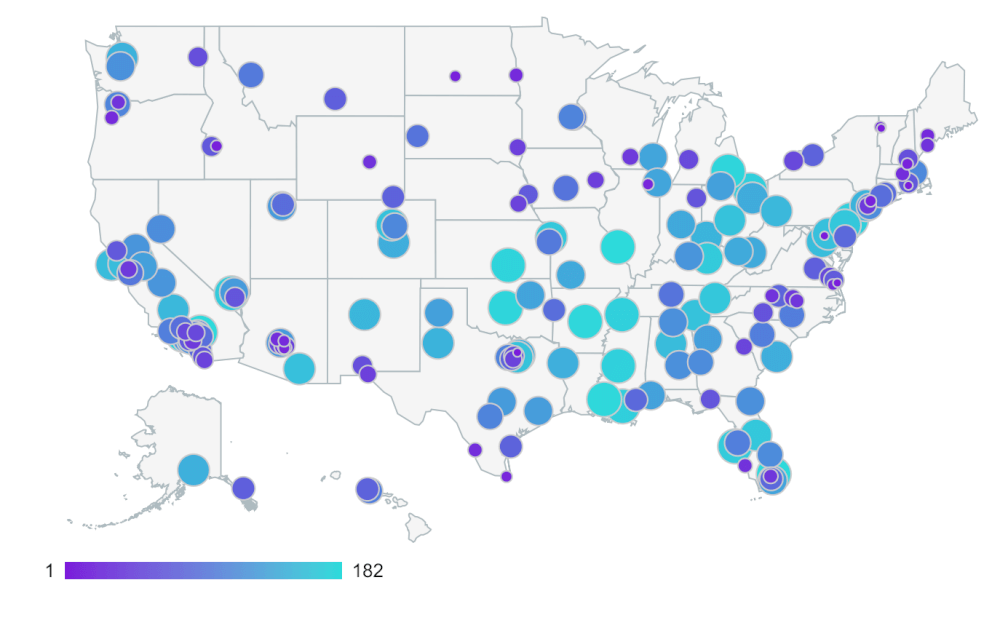
Here is an interactive map showing the cities included with a link to their information:
People encounter hazards every day, some serious, others rare and innocuous. But we fear certain kinds more than others. According to Gallup, four in 10 Americans “fear being a victim of a mass shooting,” while 24 percent of U.S. adults are concerned about terrorism. Many also worry about falling victim to hate crimes or sexual assault. The list goes on, and these sentiments often are expressed in response to recent headlines.
But people can feel unsafe in other ways, too. Besides the types of hazards that can cause bodily injury or other physical harm, taking out an unaffordable second mortgage, forgoing health insurance or even visiting unsecured websites are also ways people run into danger. At the top of the list of worries is cybercrime, which 71 percent of Americans worry about.
No one can avoid all danger, however, and we take on a certain level of risk based on where we choose to live. Some cities are simply better at protecting their residents from harm. To determine where Americans can feel most secure — in more than one sense — WalletHub compared more than 180 cities across 39 key indicators of safety. Our data set ranges from assaults per capita to unemployment rate to road quality. Read on for our findings, a detailed description of our methodology and a Q&A with safety experts for additional insight.Safest Cities in the U.S.
| Overall Rank (1 = Safest) |
City | Total Score | ‘Home & Community Safety’ Rank | ‘Natural-Disaster Risk’ Rank | ‘Financial Safety’ Rank |
|---|---|---|---|---|---|
| 1 | Columbia, MD | 85.98 | 4 | 63 | 34 |
| 2 | South Burlington, VT | 84.94 | 15 | 36 | 10 |
| 3 | Plano, TX | 84.11 | 1 | 113 | 41 |
| 4 | Virginia Beach, VA | 83.67 | 9 | 44 | 22 |
| 5 | Warwick, RI | 83.46 | 11 | 22 | 51 |
| 6 | Gilbert, AZ | 83.31 | 8 | 14 | 48 |
| 7 | Yonkers, NY | 83.28 | 2 | 39 | 121 |
| 8 | Bismarck, ND | 82.66 | 24 | 64 | 52 |
| 9 | Nashua, NH | 82.37 | 23 | 27 | 53 |
| 10 | Boise, ID | 82.15 | 30 | 71 | 1 |
| 11 | Brownsville, TX | 82.09 | 22 | 2 | 131 |
| 12 | Chandler, AZ | 81.79 | 27 | 8 | 44 |
| 13 | Aurora, IL | 81.75 | 3 | 91 | 150 |
| 14 | Chesapeake, VA | 81.71 | 19 | 69 | 39 |
| 15 | Scottsdale, AZ | 81.64 | 26 | 53 | 33 |
| 16 | Burlington, VT | 81.61 | 43 | 37 | 27 |
| 17 | Lewiston, ME | 81.54 | 67 | 12 | 6 |
| 18 | Fargo, ND | 81.33 | 32 | 77 | 29 |
| 19 | Salem, OR | 81.02 | 40 | 70 | 25 |
| 20 | Worcester, MA | 80.77 | 31 | 17 | 58 |
| 21 | Laredo, TX | 80.59 | 47 | 24 | 60 |
| 22 | Peoria, AZ | 80.38 | 36 | 26 | 64 |
| 23 | Portland, ME | 80.32 | 68 | 11 | 13 |
| 24 | Cape Coral, FL | 80.19 | 6 | 111 | 155 |
| 25 | Casper, WY | 79.95 | 41 | 20 | 137 |
| 26 | Vancouver, WA | 79.87 | 54 | 87 | 12 |
| 27 | Winston-Salem, NC | 79.82 | 38 | 40 | 117 |
| 28 | Raleigh, NC | 79.69 | 64 | 55 | 40 |
| 29 | Pembroke Pines, FL | 79.44 | 21 | 48 | 153 |
| 30 | Irvine, CA | 79.34 | 5 | 150 | 83 |
| 31 | Madison, WI | 79.27 | 62 | 89 | 4 |
| 32 | Durham, NC | 79.25 | 57 | 42 | 59 |
| 33 | Fremont, CA | 79.22 | 14 | 157 | 15 |
| 34 | Jersey City, NJ | 79.13 | 16 | 84 | 147 |
| 35 | Tempe, AZ | 79.12 | 51 | 9 | 89 |
| 36 | Cedar Rapids, IA | 78.99 | 46 | 101 | 55 |
| 37 | Sioux Falls, SD | 78.95 | 49 | 103 | 30 |
| 38 | El Paso, TX | 78.79 | 34 | 74 | 140 |
| 39 | Chula Vista, CA | 78.77 | 17 | 132 | 65 |
| 40 | Mesa, AZ | 78.77 | 50 | 18 | 90 |
| 41 | Grand Prairie, TX | 78.70 | 20 | 112 | 116 |
| 42 | Lincoln, NE | 78.69 | 60 | 105 | 36 |
| 43 | Augusta, GA | 78.49 | 66 | 61 | 127 |
| 44 | Glendale, CA | 78.22 | 7 | 151 | 101 |
| 45 | Rancho Cucamonga, CA | 78.14 | 12 | 159 | 57 |
| 46 | Buffalo, NY | 77.97 | 71 | 5 | 86 |
| 47 | Glendale, AZ | 77.97 | 56 | 13 | 119 |
| 48 | Grand Rapids, MI | 77.95 | 75 | 7 | 76 |
| 49 | Newport News, VA | 77.87 | 73 | 21 | 70 |
| 50 | Spokane, WA | 77.79 | 86 | 19 | 38 |
| 51 | Irving, TX | 77.77 | 28 | 125 | 85 |
| 52 | Las Cruces, NM | 77.66 | 70 | 66 | 158 |
| 53 | Manchester, NH | 77.56 | 90 | 30 | 49 |
| 54 | Charlotte, NC | 77.46 | 69 | 57 | 75 |
| 55 | Fort Wayne, IN | 77.14 | 77 | 59 | 96 |
| 56 | San Diego, CA | 77.11 | 45 | 130 | 42 |
| 57 | Henderson, NV | 77.06 | 44 | 95 | 128 |
| 58 | Tallahassee, FL | 76.94 | 82 | 28 | 105 |
| 59 | Nampa, ID | 76.93 | 88 | 49 | 81 |
| 60 | Santa Rosa, CA | 76.88 | 48 | 153 | 11 |
| 61 | Huntington Beach, CA | 76.87 | 18 | 170 | 67 |
| 62 | Providence, RI | 76.82 | 83 | 10 | 99 |
| 63 | Omaha, NE | 76.66 | 65 | 107 | 47 |
| 64 | Norfolk, VA | 76.62 | 76 | 81 | 68 |
| 65 | Billings, MT | 76.53 | 102 | 58 | 37 |
| 66 | Juneau, AK | 76.51 | 128 | 50 | 9 |
| 67 | Richmond, VA | 76.42 | 87 | 75 | 110 |
| 68 | Cheyenne, WY | 76.39 | 78 | 97 | 114 |
| 69 | Corpus Christi, TX | 76.39 | 91 | 3 | 109 |
| 70 | Arlington, TX | 76.29 | 39 | 122 | 124 |
| 71 | Pearl City, HI | 76.22 | 10 | N/A | 16 |
| 72 | Rochester, NY | 76.12 | 84 | 4 | 142 |
| 73 | Greensboro, NC | 76.05 | 89 | 33 | 115 |
| 74 | Oceanside, CA | 75.71 | 55 | 144 | 45 |
| 75 | Hialeah, FL | 75.65 | 13 | 128 | 176 |
| 76 | Dover, DE | 75.51 | 116 | 1 | 148 |
| 77 | Gulfport, MS | 75.21 | 103 | 56 | 134 |
| 78 | Salt Lake City, UT | 75.11 | 97 | 116 | 14 |
| 79 | New Haven, CT | 74.98 | 106 | 6 | 132 |
| 80 | Bridgeport, CT | 74.96 | 85 | 16 | 170 |
| 81 | Fort Smith, AR | 74.71 | 105 | 94 | 78 |
| 82 | Moreno Valley, CA | 74.68 | 25 | 166 | 146 |
| 83 | Santa Clarita, CA | 74.55 | 29 | 168 | 136 |
| 84 | Garden Grove, CA | 74.51 | 35 | 171 | 100 |
| 85 | Rapid City, SD | 74.49 | 99 | 129 | 26 |
| 86 | Des Moines, IA | 74.46 | 63 | 143 | 73 |
| 87 | Nashville, TN | 74.46 | 108 | 115 | 19 |
| 88 | Fontana, CA | 74.33 | 37 | 163 | 118 |
| 89 | San Jose, CA | 74.31 | 81 | 169 | 7 |
| 90 | Ontario, CA | 74.20 | 53 | 156 | 92 |
| 91 | Overland Park, KS | 74.18 | 112 | 121 | 8 |
| 92 | Missoula, MT | 74.00 | 114 | 108 | 80 |
| 93 | St. Paul, MN | 73.77 | 42 | N/A | 18 |
| 94 | Fayetteville, NC | 73.66 | 107 | 51 | 156 |
| 95 | Columbia, SC | 73.62 | 94 | 83 | 151 |
| 96 | Honolulu, HI | 73.61 | 52 | N/A | 5 |
| T-97 | Tampa, FL | 73.45 | 92 | 92 | 138 |
| T-97 | Oxnard, CA | 73.45 | 58 | 148 | 139 |
| 99 | Anaheim, CA | 73.09 | 59 | 154 | 112 |
| 100 | Minneapolis, MN | 72.96 | 113 | 131 | 21 |
| 101 | San Antonio, TX | 72.93 | 111 | 73 | 126 |
| 102 | Fort Worth, TX | 72.90 | 79 | 134 | 144 |
| 103 | Portland, OR | 72.66 | 138 | 86 | 3 |
| 104 | Riverside, CA | 72.47 | 72 | 164 | 107 |
| 105 | Aurora, CO | 72.46 | 98 | 133 | 62 |
| 106 | Boston, MA | 72.43 | 143 | 35 | 17 |
| 107 | New York, NY | 72.38 | 131 | 34 | 71 |
| 108 | Port St. Lucie, FL | 72.34 | 33 | N/A | 94 |
| 109 | Columbus, GA | 72.33 | 117 | 38 | 167 |
| 110 | Reno, NV | 72.30 | 104 | 158 | 23 |
| 111 | Jacksonville, FL | 72.27 | 127 | 62 | 104 |
| 112 | Montgomery, AL | 72.26 | 95 | 93 | 178 |
| 113 | Huntsville, AL | 72.05 | 93 | 142 | 106 |
| 114 | Tacoma, WA | 72.01 | 101 | 145 | 46 |
| 115 | Louisville, KY | 71.97 | 118 | 106 | 72 |
| 116 | Sacramento, CA | 71.91 | 109 | 119 | 93 |
| 117 | Long Beach, CA | 71.80 | 80 | 152 | 120 |
| 118 | Fresno, CA | 71.61 | 115 | 117 | 113 |
| 119 | Santa Ana, CA | 71.34 | 74 | 167 | 145 |
| 120 | Phoenix, AZ | 71.06 | 136 | 25 | 111 |
| 121 | North Las Vegas, NV | 71.02 | 100 | 99 | 172 |
| 122 | West Valley City, UT | 70.82 | 61 | N/A | 31 |
| 123 | Austin, TX | 70.39 | 142 | 98 | 35 |
| 124 | Houston, TX | 70.35 | 119 | 102 | 154 |
| 125 | Atlanta, GA | 70.34 | 121 | 82 | 159 |
| 126 | Modesto, CA | 70.31 | 126 | 135 | 54 |
| 127 | Amarillo, TX | 70.28 | 120 | 162 | 66 |
| 128 | Toledo, OH | 70.26 | 129 | 60 | 171 |
| 129 | Mobile, AL | 70.25 | 135 | 43 | 168 |
| 130 | Tulsa, OK | 70.19 | 124 | 120 | 84 |
| 131 | Miami, FL | 70.05 | 96 | 118 | 177 |
| 132 | Milwaukee, WI | 69.69 | 140 | 52 | 123 |
| 133 | Chicago, IL | 69.41 | 123 | 79 | 174 |
| 134 | Indianapolis, IN | 68.73 | 134 | 124 | 108 |
| 135 | Springfield, MO | 68.41 | 141 | 127 | 79 |
| 136 | Huntington, WV | 68.39 | 159 | 47 | 50 |
| 137 | Charleston, WV | 68.24 | 158 | 45 | 69 |
| 138 | Akron, OH | 68.12 | 146 | 68 | 166 |
| 139 | Colorado Springs, CO | 68.12 | 149 | 126 | 24 |
| 140 | Charleston, SC | 68.10 | 137 | 165 | 63 |
| 141 | Shreveport, LA | 68.07 | 139 | 100 | 163 |
| 142 | Anchorage, AK | 67.93 | 132 | 161 | 103 |
| 143 | Seattle, WA | 67.80 | 151 | 141 | 2 |
| 144 | Garland, TX | 67.66 | 150 | 110 | 102 |
| 145 | Lubbock, TX | 67.64 | 176 | 114 | 32 |
| 146 | Cincinnati, OH | 67.64 | 148 | 76 | 133 |
| 147 | Newark, NJ | 67.51 | 130 | 29 | 182 |
| 148 | Albuquerque, NM | 67.28 | 147 | 88 | 143 |
| 149 | Pittsburgh, PA | 67.06 | 152 | 72 | 77 |
| 150 | Bakersfield, CA | 67.06 | 125 | 146 | 165 |
| 151 | Stockton, CA | 66.99 | 144 | 140 | 98 |
| 152 | San Francisco, CA | 66.59 | 153 | 123 | 20 |
| 153 | Birmingham, AL | 66.43 | 122 | 136 | 180 |
| 154 | Oakland, CA | 66.19 | 145 | 155 | 82 |
| 155 | Washington, DC | 65.47 | 166 | 80 | 61 |
| 156 | Baltimore, MD | 65.08 | 155 | 67 | 149 |
| 157 | Tucson, AZ | 64.89 | 172 | 65 | 91 |
| 158 | Chattanooga, TN | 64.84 | 164 | 109 | 56 |
| 159 | Columbus, OH | 64.81 | 169 | 46 | 87 |
| 160 | Denver, CO | 64.74 | 154 | 139 | 43 |
| 161 | Dallas, TX | 64.64 | 157 | 104 | 125 |
| 162 | Wilmington, DE | 64.63 | 168 | 23 | 164 |
| 163 | Knoxville, TN | 64.28 | 171 | 78 | 88 |
| 164 | Orlando, FL | 63.92 | 175 | 32 | 74 |
| 165 | Kansas City, MO | 63.63 | 156 | 138 | 95 |
| 166 | Lexington-Fayette, KY | 62.94 | 133 | N/A | 28 |
| 167 | St. Petersburg, FL | 62.69 | 110 | N/A | 122 |
| 168 | Las Vegas, NV | 62.54 | 167 | 96 | 152 |
| 169 | Cleveland, OH | 62.39 | 162 | 54 | 179 |
| 170 | New Orleans, LA | 61.81 | 174 | 31 | 162 |
| 171 | Philadelphia, PA | 61.61 | 177 | 15 | 157 |
| 172 | Memphis, TN | 61.38 | 173 | 85 | 173 |
| 173 | Jackson, MS | 61.30 | 161 | 137 | 175 |
| 174 | Los Angeles, CA | 60.79 | 165 | 149 | 130 |
| 175 | Wichita, KS | 60.39 | 163 | 172 | 129 |
| 176 | Oklahoma City, OK | 57.73 | 160 | 173 | 97 |
| 177 | Detroit, MI | 57.42 | 180 | 41 | 181 |
| 178 | Little Rock, AR | 56.63 | 179 | 147 | 141 |
| 179 | Baton Rouge, LA | 56.39 | 182 | 90 | 135 |
| 180 | San Bernardino, CA | 55.50 | 181 | 160 | 161 |
| 181 | Fort Lauderdale, FL | 47.88 | 170 | N/A | 169 |
| 182 | St. Louis, MO | 44.47 | 178 | N/A | 160 |
Click here to subscribe FREE to Ray Hanania's Columns


His award winning columns can be found at www.HANANIA.COM Subscribe FREE today
Hanania also writes about Middle East issues for the Arab News, and The Arab Daily News criticizing government policies in the Israeli-Palestinian conflict.
Hanania was named "Best Ethnic American Columnist" by the New America Media in November 2007, and is the 2009 recipient of the SPJ National Sigma Delta Chi Award for column writing.
Email Ray Hanania at [email protected].
Follow RayHanania at Twitter
- Leving Court Victory Restored Dad in His Children’s Lives - April 9, 2026
- Ryan Bill Expands Reduced Fee Services for Seniors and Illinoisans with Disabilities - April 9, 2026
- Illegal Alien Facing State Murder Charge Now Charged in Federal Court With Illegally Possessing Firearm in Chicago - April 9, 2026