


Click here to subscribe FREE to Ray Hanania's Columns
US Foreclosure activity shows continued rise in Third Quarter, approaching levels seen before pandemic
Highest Foreclosure Rates in New Jersey, South Carolina, and Delaware; Average Time to Foreclose Nationwide Hit Pre-Pandemic Levels
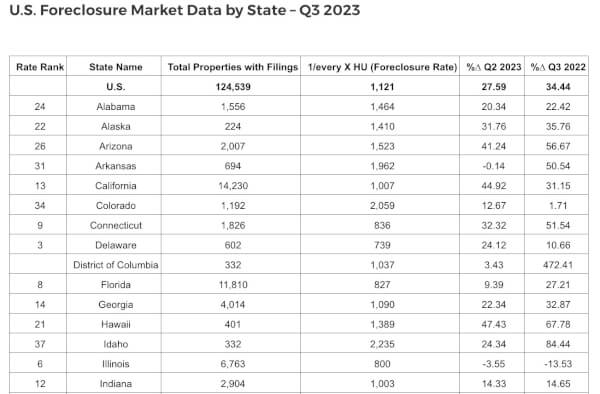
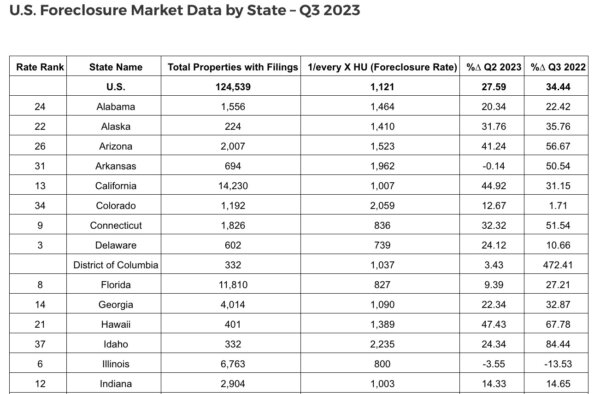
ATTOM, a leading curator of land, property, and real estate data, released its Q3 2023 U.S. Foreclosure Market Report, which shows there were a total of 124,539 U.S. properties with foreclosure filings — default notices, scheduled auctions or bank repossessions — up 28 percent from the previous quarter and 34 percent from a year ago.
The report also shows there were a total of 37,679 U.S. properties with foreclosure filings in September 2023, up 11 percent from the previous month and up 18 percent from September 2022.
Foreclosure starts tick upwards from last year
Lenders started the foreclosure process on 68,961 U.S. properties in Q3 2023, down 1 percent from the previous quarter but up 3 percent from a year ago — nearly reaching pre-pandemic levels.
States that had 1,000 or more foreclosure starts in Q3 2023 and saw the greatest annual increases were North Carolina (up 53 percent); Louisiana (up 47 percent); Pennsylvania (up 24 percent); Alabama (up 18 percent); and Nevada (up 16 percent).
“Foreclosures are on the rise again this quarter, as indicated by our latest foreclosure numbers,” said Rob Barber, CEO at ATTOM. ” The number of new cases filed by lenders in the third quarter did rise just a small amount from the same period last year and actually dipped a bit quarterly – signs that the upward pattern may be easing. But foreclosure starts are nearly back to where they were two years ago when the federal government lifted a pandemic-related moratorium on most foreclosure filings. This rise in foreclosures might also be attributed to pending filings finally processing. Even with the national economic upturn and job stability, it’s evident that some homeowners are still grappling with the pandemic’s financial aftermath or encountering new challenges.”
Among the 223 metropolitan statistical areas analyzed in the report those that posted the greatest number of foreclosure starts in Q3 2023, included New York, New York (4,514 foreclosure starts); Chicago, Illinois (2,584 foreclosure starts); Houston, Texas (2,279 foreclosure starts); Los Angeles, California (2,273 foreclosure starts); and Philadelphia, Pennsylvania (2,104 foreclosure starts).
Counter to the national trend of annual increases, among those metropolitan areas with a population greater than one million that saw a decline in foreclosure starts in Q3 2023 were Salt Lake City, Utah (down 74 percent); Chicago, Illinois (down 35 percent); Kansas City, Missouri (down 34 percent); Columbus, Ohio (down 22 percent); and Milwaukee, Wisconsin (down 21 percent).
Highest foreclosure rates in New Jersey, South Carolina, and Delaware
Nationwide one in every 1,121 properties had a foreclosure filing in Q3 2023. States with the highest foreclosure rates in Q3 2023 were New Jersey (one in every 595 housing units with a foreclosure filing); South Carolina (one in every 730); Delaware (one in every 739); Nevada (one in every 763); and Maryland (one in every 780).
Among 223 metropolitan statistical areas analyzed in the report, those with the highest foreclosure rates in Q3 2023 were Houston, Texas (one in every 371 housing units with a foreclosure filing); Atlantic City, New Jersey (one in every 453); Cleveland, Ohio (one in every 459); Bakersfield, California (one in every 465); and Columbia, South Carolina (one in every 503).
Bank repossessions increase nationwide
Lenders repossessed 11,020 U.S. properties through foreclosure (REO) in Q3 2023, up 9 percent from the previous quarter and up 5 percent from a year ago.
U.S. Completed Foreclosures (REOs)
States that posted the largest number of completed foreclosures in Q3 2023, included California (1,277 REOs); Illinois (1,057 REOs); Pennsylvania (743 REOs); New York (673 REOs); and Ohio (635 REOs).
Average time to foreclose decreases 12 percent annually
Properties foreclosed in Q3 2023 had been in the foreclosure process an average of 778 days, down 36 percent from 1,212 days in the previous quarter and down 12 percent from 885 days in Q3 2022, to the lowest level since Q2 2020.
Average Days to Complete Foreclosure
States with the longest average foreclosure timelines for homes foreclosed in Q3 2023 were Louisiana (3,045 days); Hawaii (2,498 days); New York (1,941 days); Nevada (1,690 days); and New Jersey (1,621 days).
States with the shortest average foreclosure timelines for homes foreclosed in Q3 2023 were Texas (160 days); Montana (169 days); Wyoming (177 days); Missouri (211 days); and Michigan (213 days).
September 2023 Foreclosure Activity High-Level Takeaways
- Nationwide in September 2023 one in every 3,706 properties had a foreclosure filing.
- States with the highest foreclosure rates in September 2023 were Nevada (one in every 2,163 housing units with a foreclosure filing); Maryland (one in every 2,253 housing units); South Carolina (one in every 2,260 housing units); Delaware (one in every 2,380 housing units); and New Jersey (one in every 2,531 housing units).
- 25,042 U.S. properties started the foreclosure process in September 2023, up 9 percent from the previous month and up 15 percent from a year ago.
- Lenders completed the foreclosure process on 4,334 U.S. properties in September 2023, up 29 percent from the previous month and up 24 percent from a year ago.
U.S. Foreclosure Market Data by State – Q3 2023
|
Rate Rank |
State Name |
Total Properties with Filings |
1/every X HU (Foreclosure Rate) |
%∆ Q2 2023 |
%∆ Q3 2022 |
|
U.S. |
124,539 |
1,121 |
27.59 |
34.44 |
|
|
24 |
Alabama |
1,556 |
1,464 |
20.34 |
22.42 |
|
22 |
Alaska |
224 |
1,410 |
31.76 |
35.76 |
|
26 |
Arizona |
2,007 |
1,523 |
41.24 |
56.67 |
|
31 |
Arkansas |
694 |
1,962 |
-0.14 |
50.54 |
|
13 |
California |
14,230 |
1,007 |
44.92 |
31.15 |
|
34 |
Colorado |
1,192 |
2,059 |
12.67 |
1.71 |
|
9 |
Connecticut |
1,826 |
836 |
32.32 |
51.54 |
|
3 |
Delaware |
602 |
739 |
24.12 |
10.66 |
|
District of Columbia |
332 |
1,037 |
3.43 |
472.41 |
|
|
8 |
Florida |
11,810 |
827 |
9.39 |
27.21 |
|
14 |
Georgia |
4,014 |
1,090 |
22.34 |
32.87 |
|
21 |
Hawaii |
401 |
1,389 |
47.43 |
67.78 |
|
37 |
Idaho |
332 |
2,235 |
24.34 |
84.44 |
|
6 |
Illinois |
6,763 |
800 |
-3.55 |
-13.53 |
|
12 |
Indiana |
2,904 |
1,003 |
14.33 |
14.65 |
|
20 |
Iowa |
1,022 |
1,377 |
1.49 |
8.49 |
|
46 |
Kansas |
356 |
3,574 |
17.88 |
-12.10 |
|
41 |
Kentucky |
801 |
2,482 |
54.34 |
79.19 |
|
19 |
Louisiana |
1,580 |
1,308 |
28.25 |
45.62 |
|
32 |
Maine |
374 |
1,973 |
1.36 |
-3.61 |
|
5 |
Maryland |
3,226 |
780 |
-7.56 |
53.40 |
|
27 |
Massachusetts |
1,875 |
1,589 |
58.50 |
40.24 |
|
23 |
Michigan |
3,210 |
1,423 |
7.29 |
-9.50 |
|
30 |
Minnesota |
1,302 |
1,897 |
4.66 |
16.56 |
|
40 |
Mississippi |
554 |
2,378 |
11.69 |
9.27 |
|
33 |
Missouri |
1,395 |
1,994 |
21.94 |
23.23 |
|
48 |
Montana |
131 |
3,913 |
20.18 |
27.18 |
|
42 |
Nebraska |
334 |
2,517 |
-5.38 |
17.19 |
|
4 |
Nevada |
1,665 |
763 |
42.92 |
34.17 |
|
36 |
New Hampshire |
285 |
2,233 |
36.36 |
26.11 |
|
1 |
New Jersey |
6,279 |
595 |
30.38 |
42.67 |
|
25 |
New Mexico |
618 |
1,517 |
10.75 |
52.97 |
|
11 |
New York |
9,036 |
935 |
50.47 |
52.48 |
|
17 |
North Carolina |
3,773 |
1,239 |
24.36 |
42.59 |
|
47 |
North Dakota |
103 |
3,593 |
77.59 |
128.89 |
|
7 |
Ohio |
6,518 |
803 |
17.82 |
27.65 |
|
18 |
Oklahoma |
1,351 |
1,289 |
19.14 |
54.05 |
|
43 |
Oregon |
659 |
2,730 |
-0.75 |
15.01 |
|
15 |
Pennsylvania |
4,706 |
1,217 |
18.72 |
61.66 |
|
35 |
Rhode Island |
219 |
2,197 |
14.06 |
19.02 |
|
2 |
South Carolina |
3,184 |
730 |
28.39 |
31.84 |
|
49 |
South Dakota |
63 |
6,165 |
186.36 |
173.91 |
|
39 |
Tennessee |
1,301 |
2,314 |
13.43 |
4.92 |
|
10 |
Texas |
13,647 |
838 |
95.35 |
106.99 |
|
16 |
Utah |
929 |
1,220 |
67.99 |
65.30 |
|
50 |
Vermont |
19 |
17,554 |
-36.67 |
26.67 |
|
28 |
Virginia |
2,114 |
1,701 |
18.70 |
24.28 |
|
45 |
Washington |
1,092 |
2,904 |
31.88 |
27.42 |
|
44 |
West Virginia |
309 |
2,781 |
38.57 |
85.03 |
|
29 |
Wisconsin |
1,504 |
1,807 |
73.07 |
66.19 |
|
38 |
Wyoming |
118 |
2,304 |
9.26 |
-11.28 |
Report methodology
The ATTOM U.S. Foreclosure Market Report provides a count of the total number of properties with at least one foreclosure filing entered into the ATTOM Data Warehouse during the month and quarter. Some foreclosure filings entered into the database during the quarter may have been recorded in the previous quarter. Data is collected from more than 3,000 counties nationwide, and those counties account for more than 99 percent of the U.S. population. ATTOM’s report incorporates documents filed in all three phases of foreclosure: Default — Notice of Default (NOD) and Lis Pendens (LIS); Auction — Notice of Trustee Sale and Notice of Foreclosure Sale (NTS and NFS); and Real Estate Owned, or REO properties (that have been foreclosed on and repurchased by a bank). For the annual, midyear and quarterly reports, if more than one type of foreclosure document is received for a property during the timeframe, only the most recent filing is counted in the report. The annual, midyear, quarterly and monthly reports all check if the same type of document was filed against a property previously. If so, and if that previous filing occurred within the estimated foreclosure timeframe for the state where the property is located, the report does not count the property in the current year, quarter or month.
About ATTOM
ATTOM provides premium property data to power products that improve transparency, innovation, efficiency, and disruption in a data-driven economy. ATTOM multi-sources property tax, deed, mortgage, foreclosure, environmental risk, natural hazard, and neighborhood data for more than 155 million U.S. residential and commercial properties covering 99 percent of the nation’s population. A rigorous data management process involving more than 20 steps validates, standardizes, and enhances the real estate data collected by ATTOM, assigning each property record with a persistent, unique ID — the ATTOM ID. The 30TB ATTOM Data Warehouse fuels innovation in many industries including mortgage, real estate, insurance, marketing, government and more through flexible data delivery solutions that include bulk file licenses, property data APIs, real estate market trends, property navigator and more. Also, introducing our newest innovative solution, that offers immediate access and streamlines data management – ATTOM Cloud.
Click here to subscribe FREE to Ray Hanania's Columns


His award winning columns can be found at www.HANANIA.COM Subscribe FREE today
Hanania also writes about Middle East issues for the Arab News, and The Arab Daily News criticizing government policies in the Israeli-Palestinian conflict.
Hanania was named "Best Ethnic American Columnist" by the New America Media in November 2007, and is the 2009 recipient of the SPJ National Sigma Delta Chi Award for column writing.
Email Ray Hanania at [email protected].
Follow RayHanania at Twitter
- Leving Court Victory Restored Dad in His Children’s Lives - April 9, 2026
- Ryan Bill Expands Reduced Fee Services for Seniors and Illinoisans with Disabilities - April 9, 2026
- Illegal Alien Facing State Murder Charge Now Charged in Federal Court With Illegally Possessing Firearm in Chicago - April 9, 2026


Comments on “US Foreclosure activity shows continued rise in Third Quarter, approaching levels seen before pandemic”